
Project challenge
Employer: IBM
We had a product roadmap outlining our next steps, but it lacked user perspective on its content.
Project role
I delivered a customer survey analysis based on 100+ survey responses from customers in industries like healthcare stirring executive leadership discussion.
Collaborators: Product managers, engineers, and designers

Process highlights
Opportunity identification
We needed users’ perspectives on a list of product experiences to test strategic assumptions.
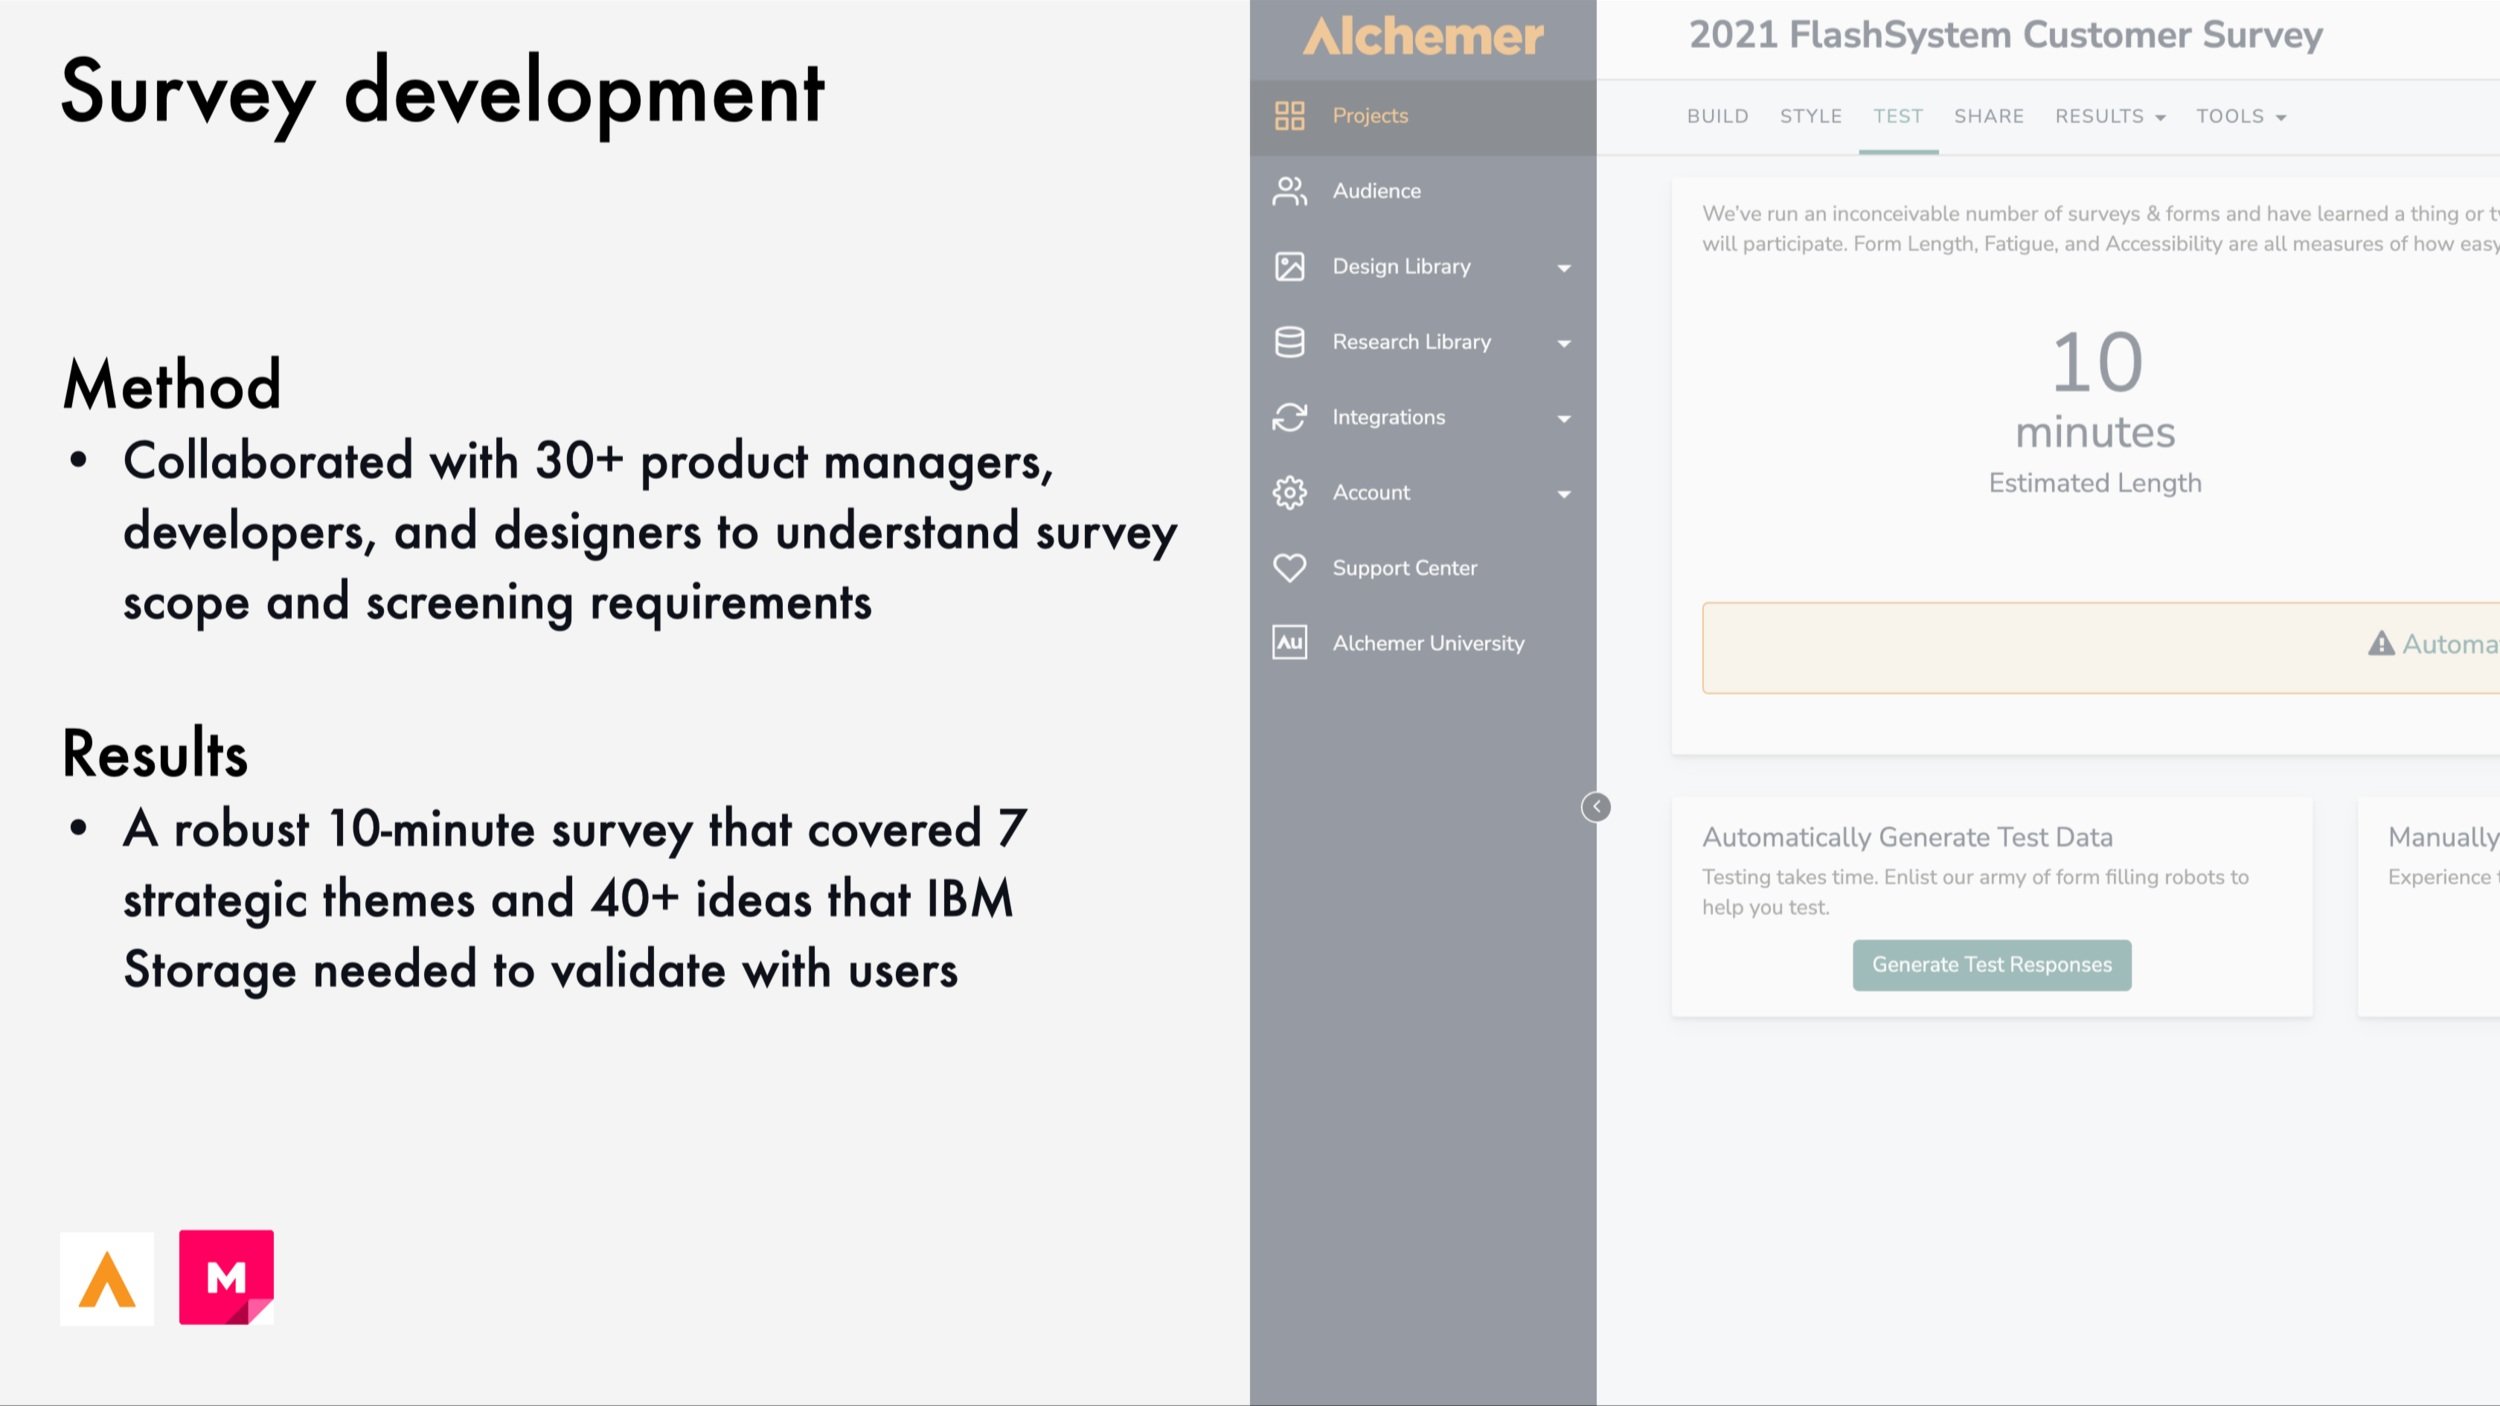
Survey development
What’s the best way to extract the insights we need regarding users’ prioritization and perspective?
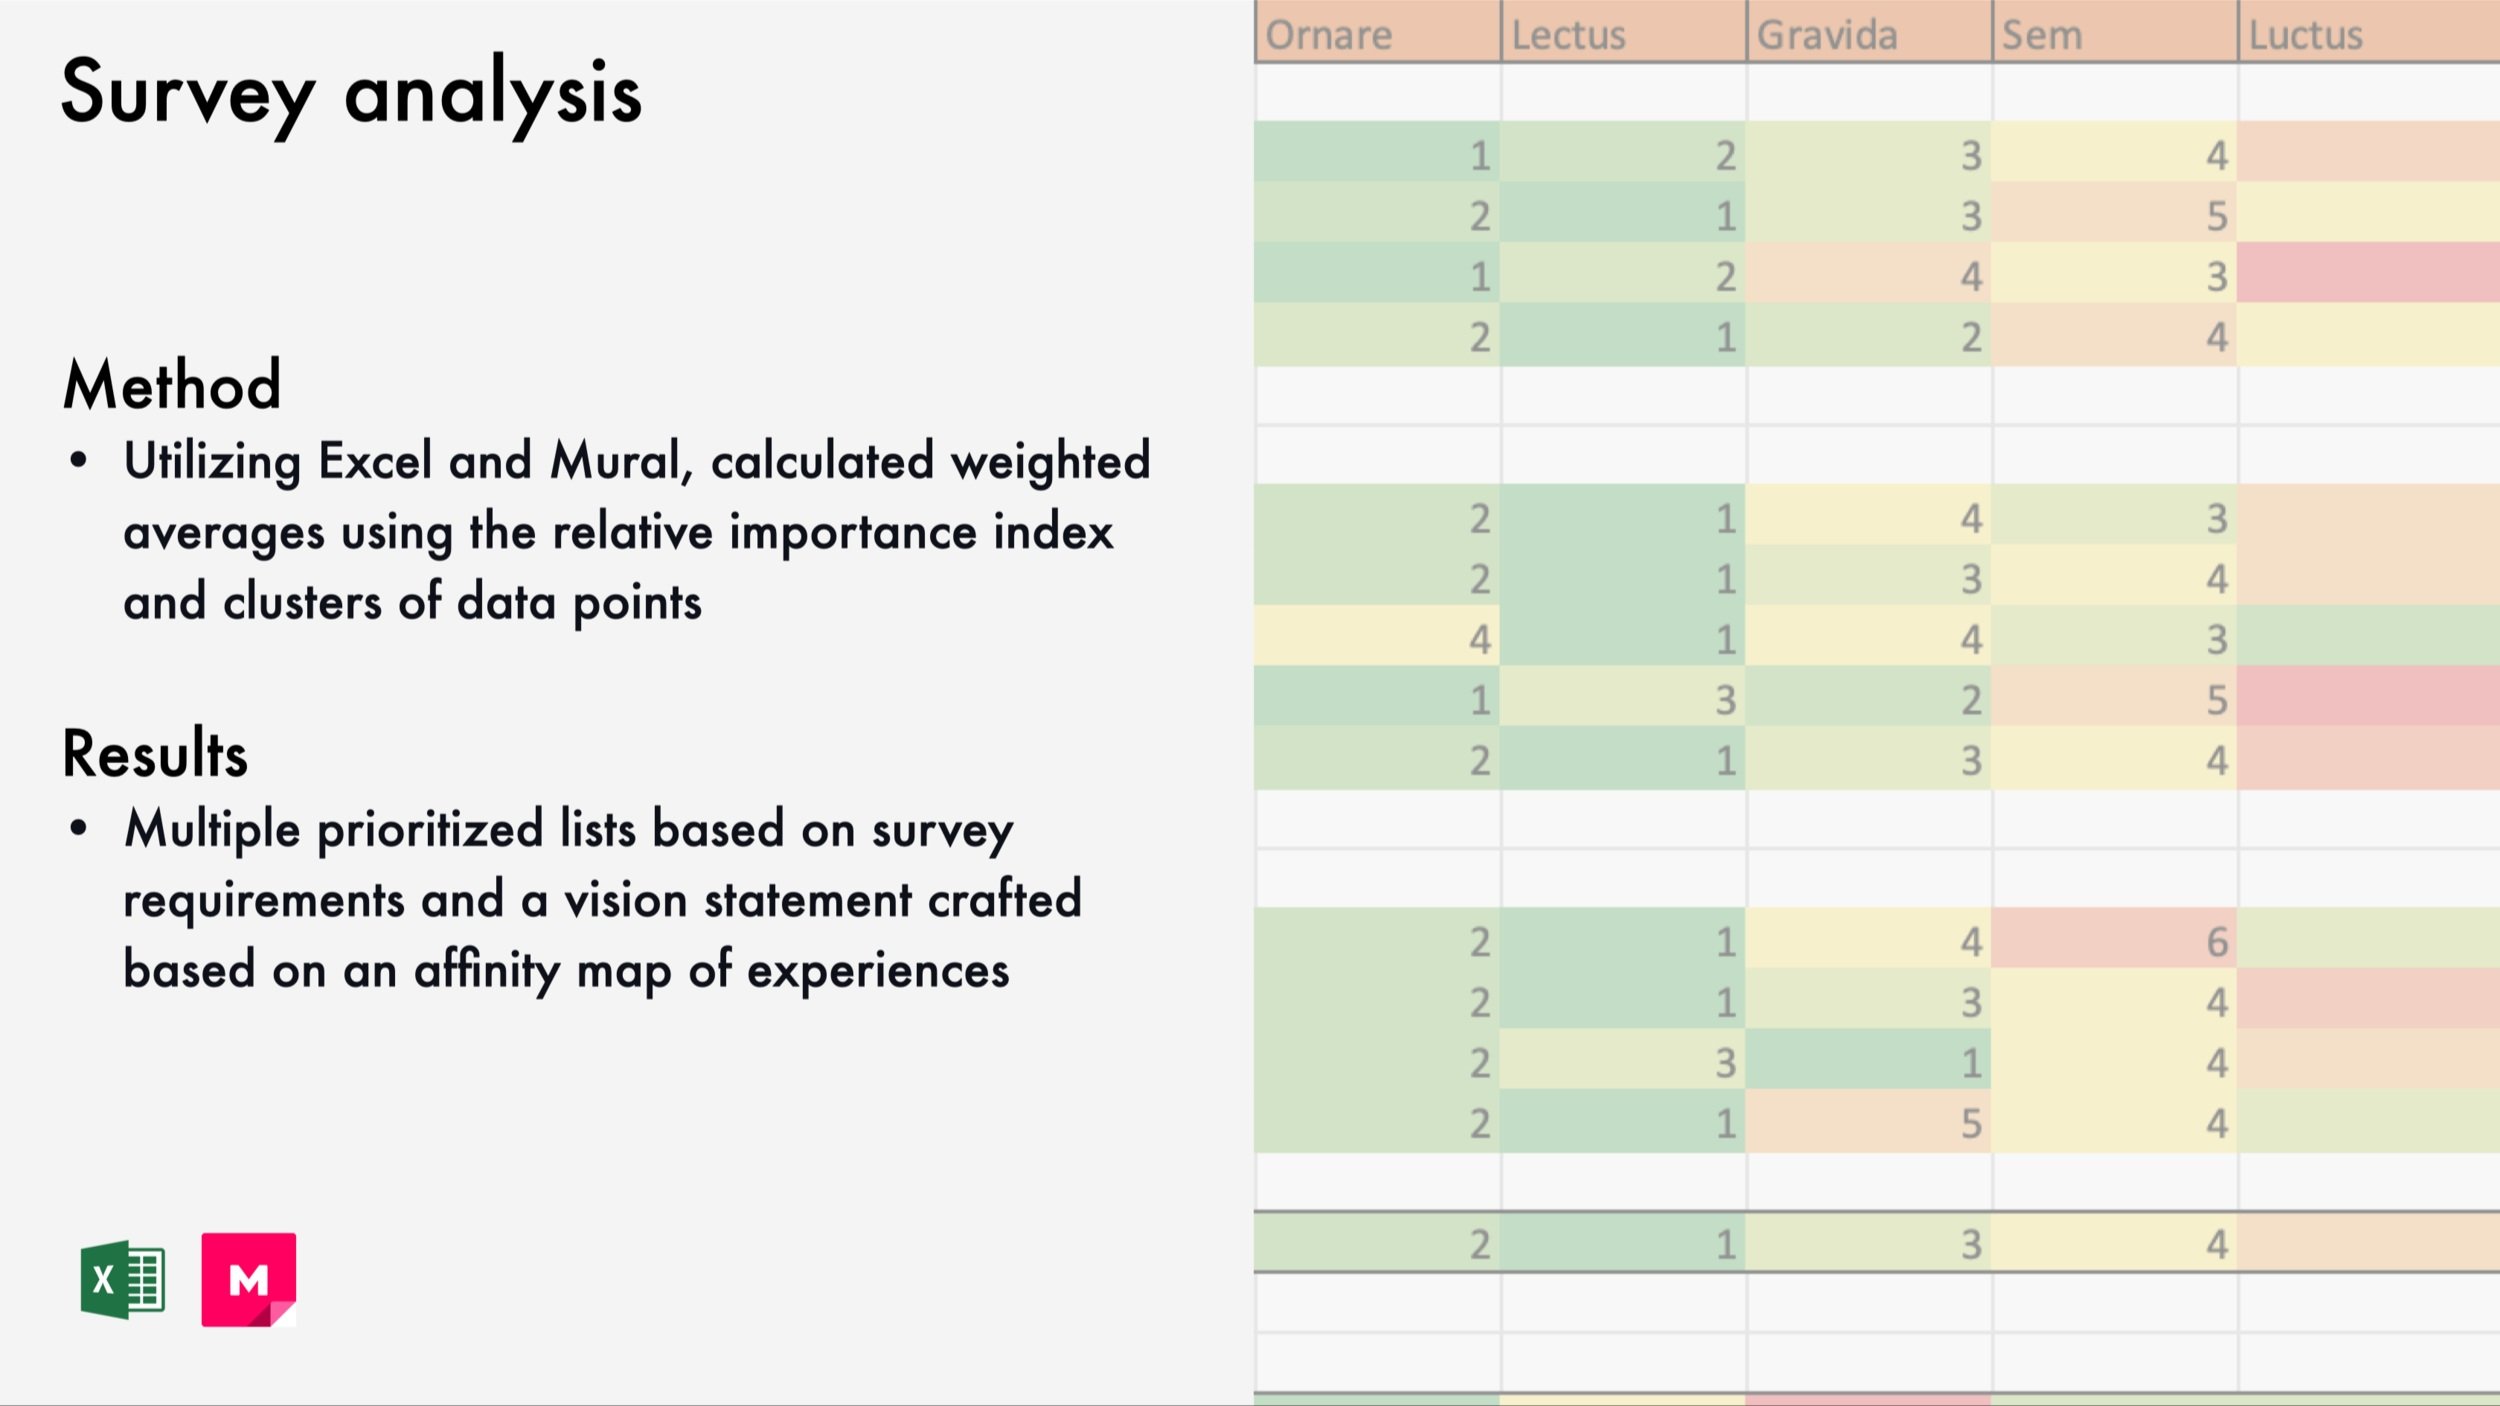
Survey analysis
What does our data inform our team as to what we should build and in what time frame?
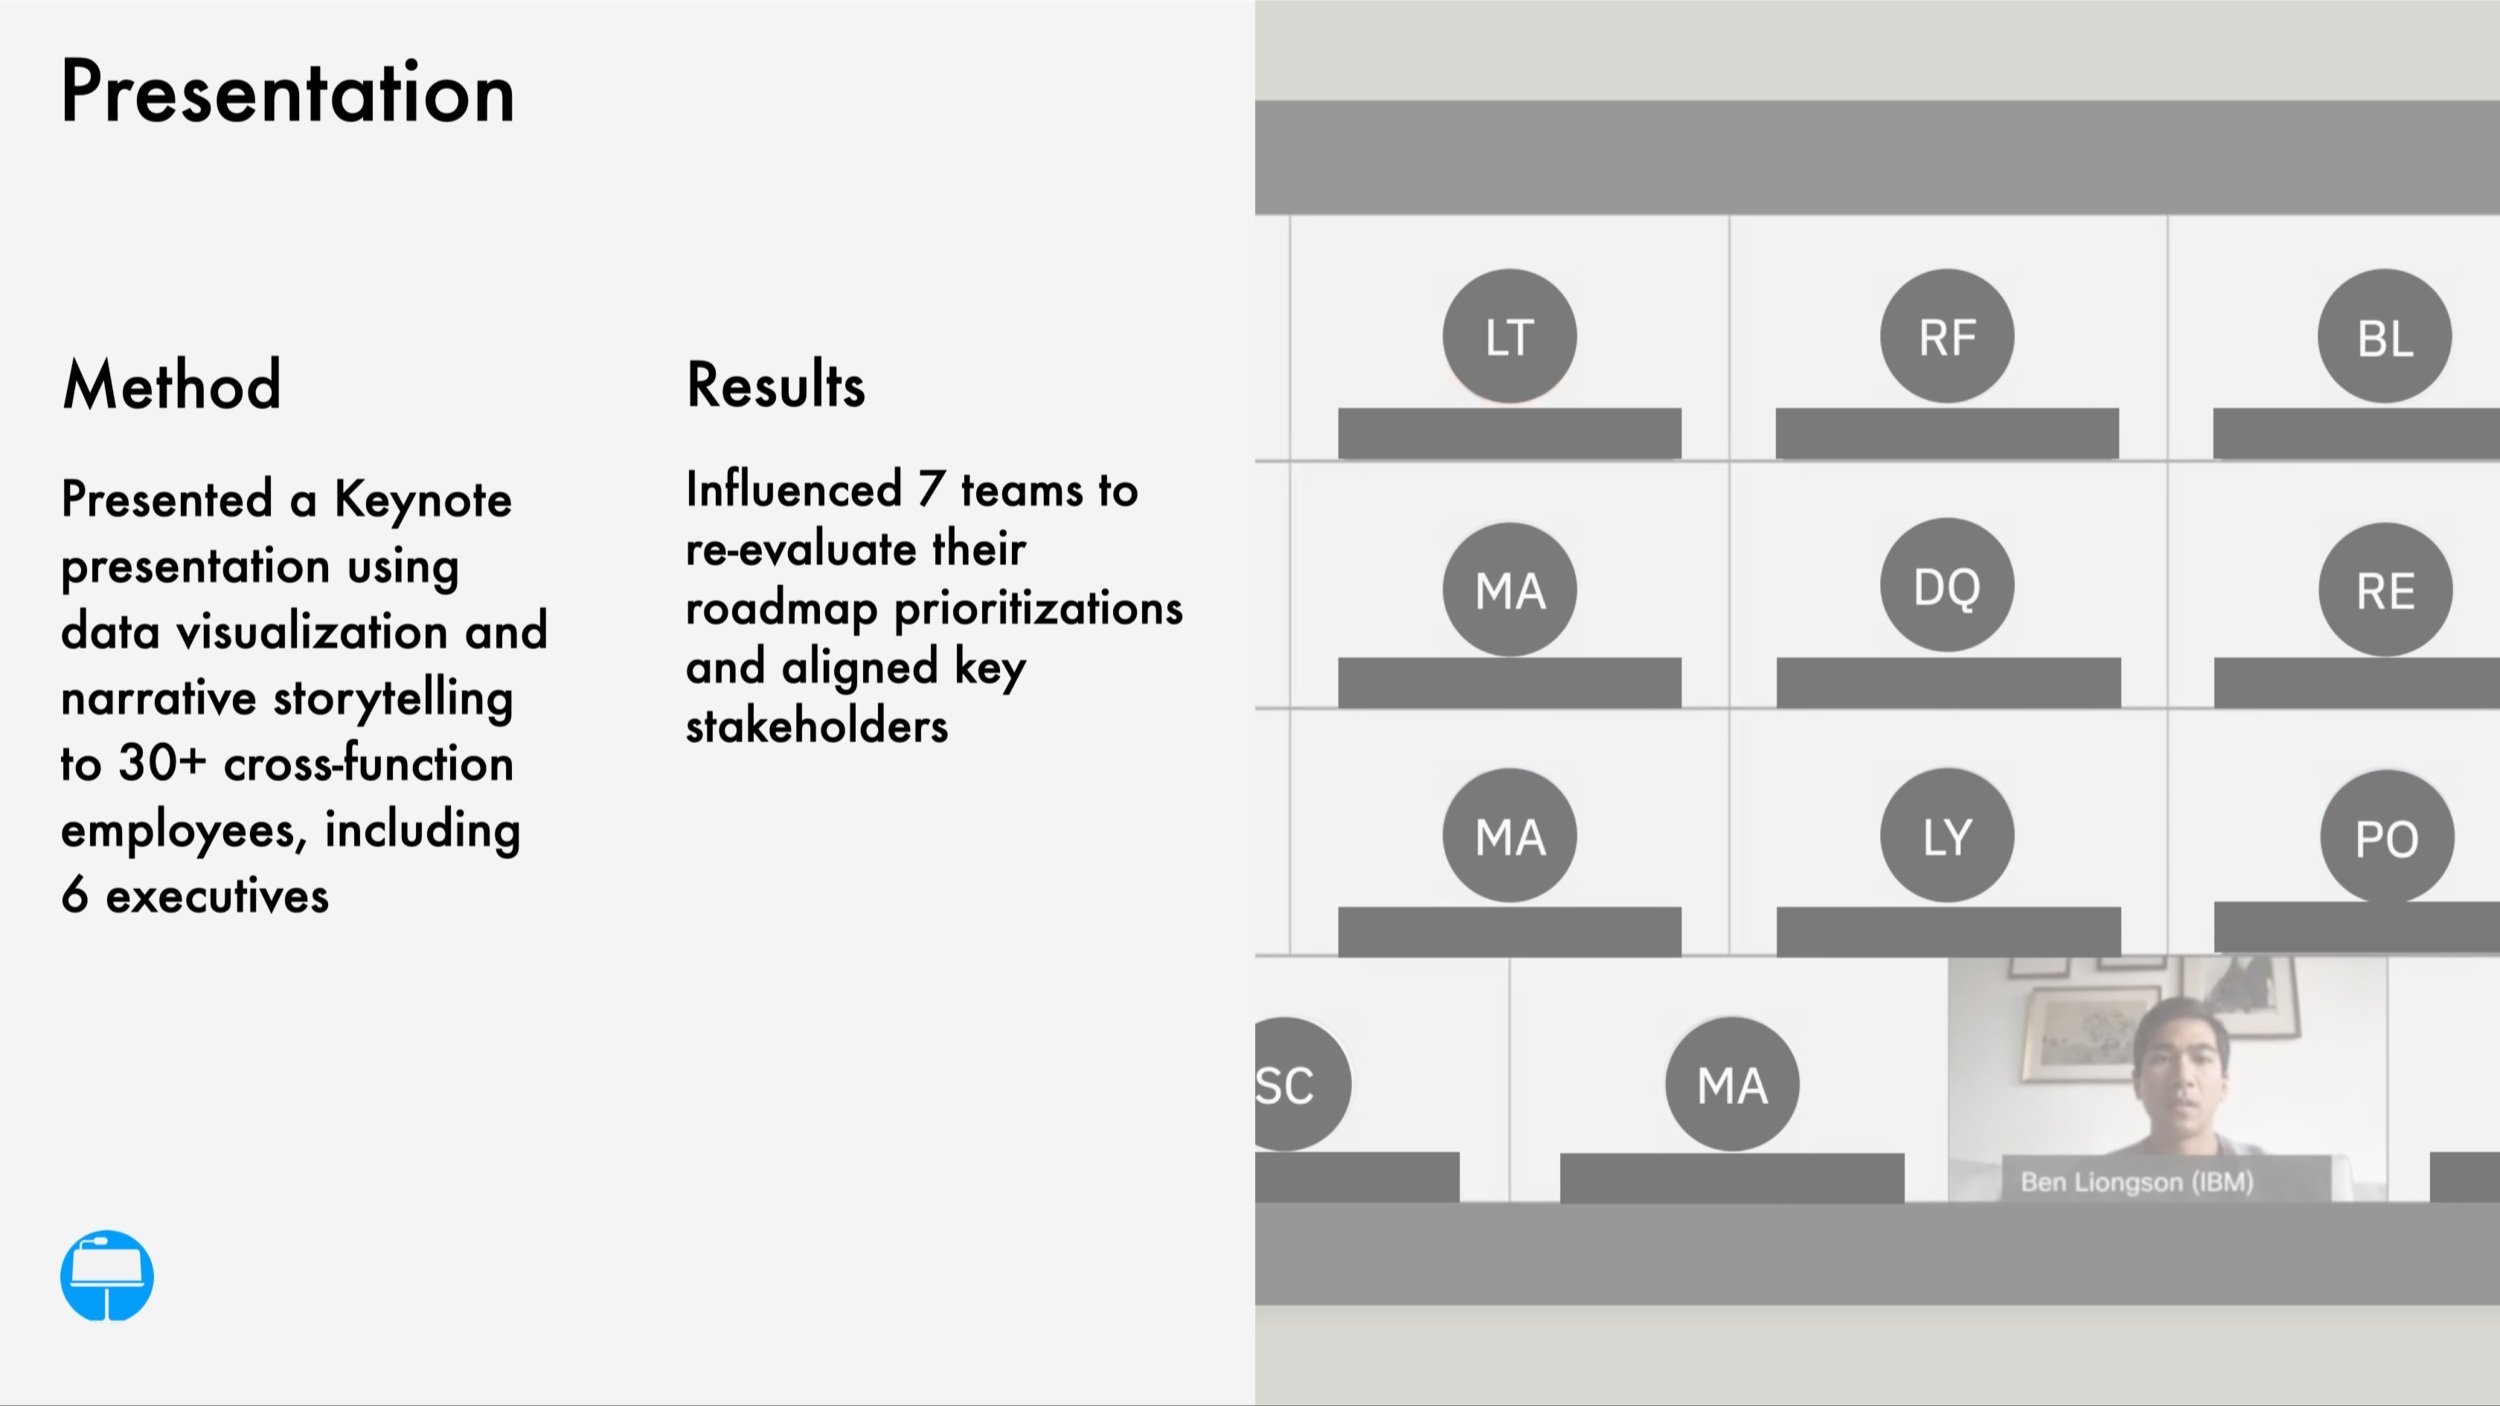
Presentation development
How do we storytell the research output in a way that effectively activates the insights?
Research tactics: Survey Design, Survey Analysis
Strategy tactics: Presentation, Storytelling, Cross-functional collaboration
Sample contributions

Value delivered
My immediate team and other product teams revised their roadmaps to incorporate user feedback, enabling a strategic approach informed by business, market, and direct customer signals.
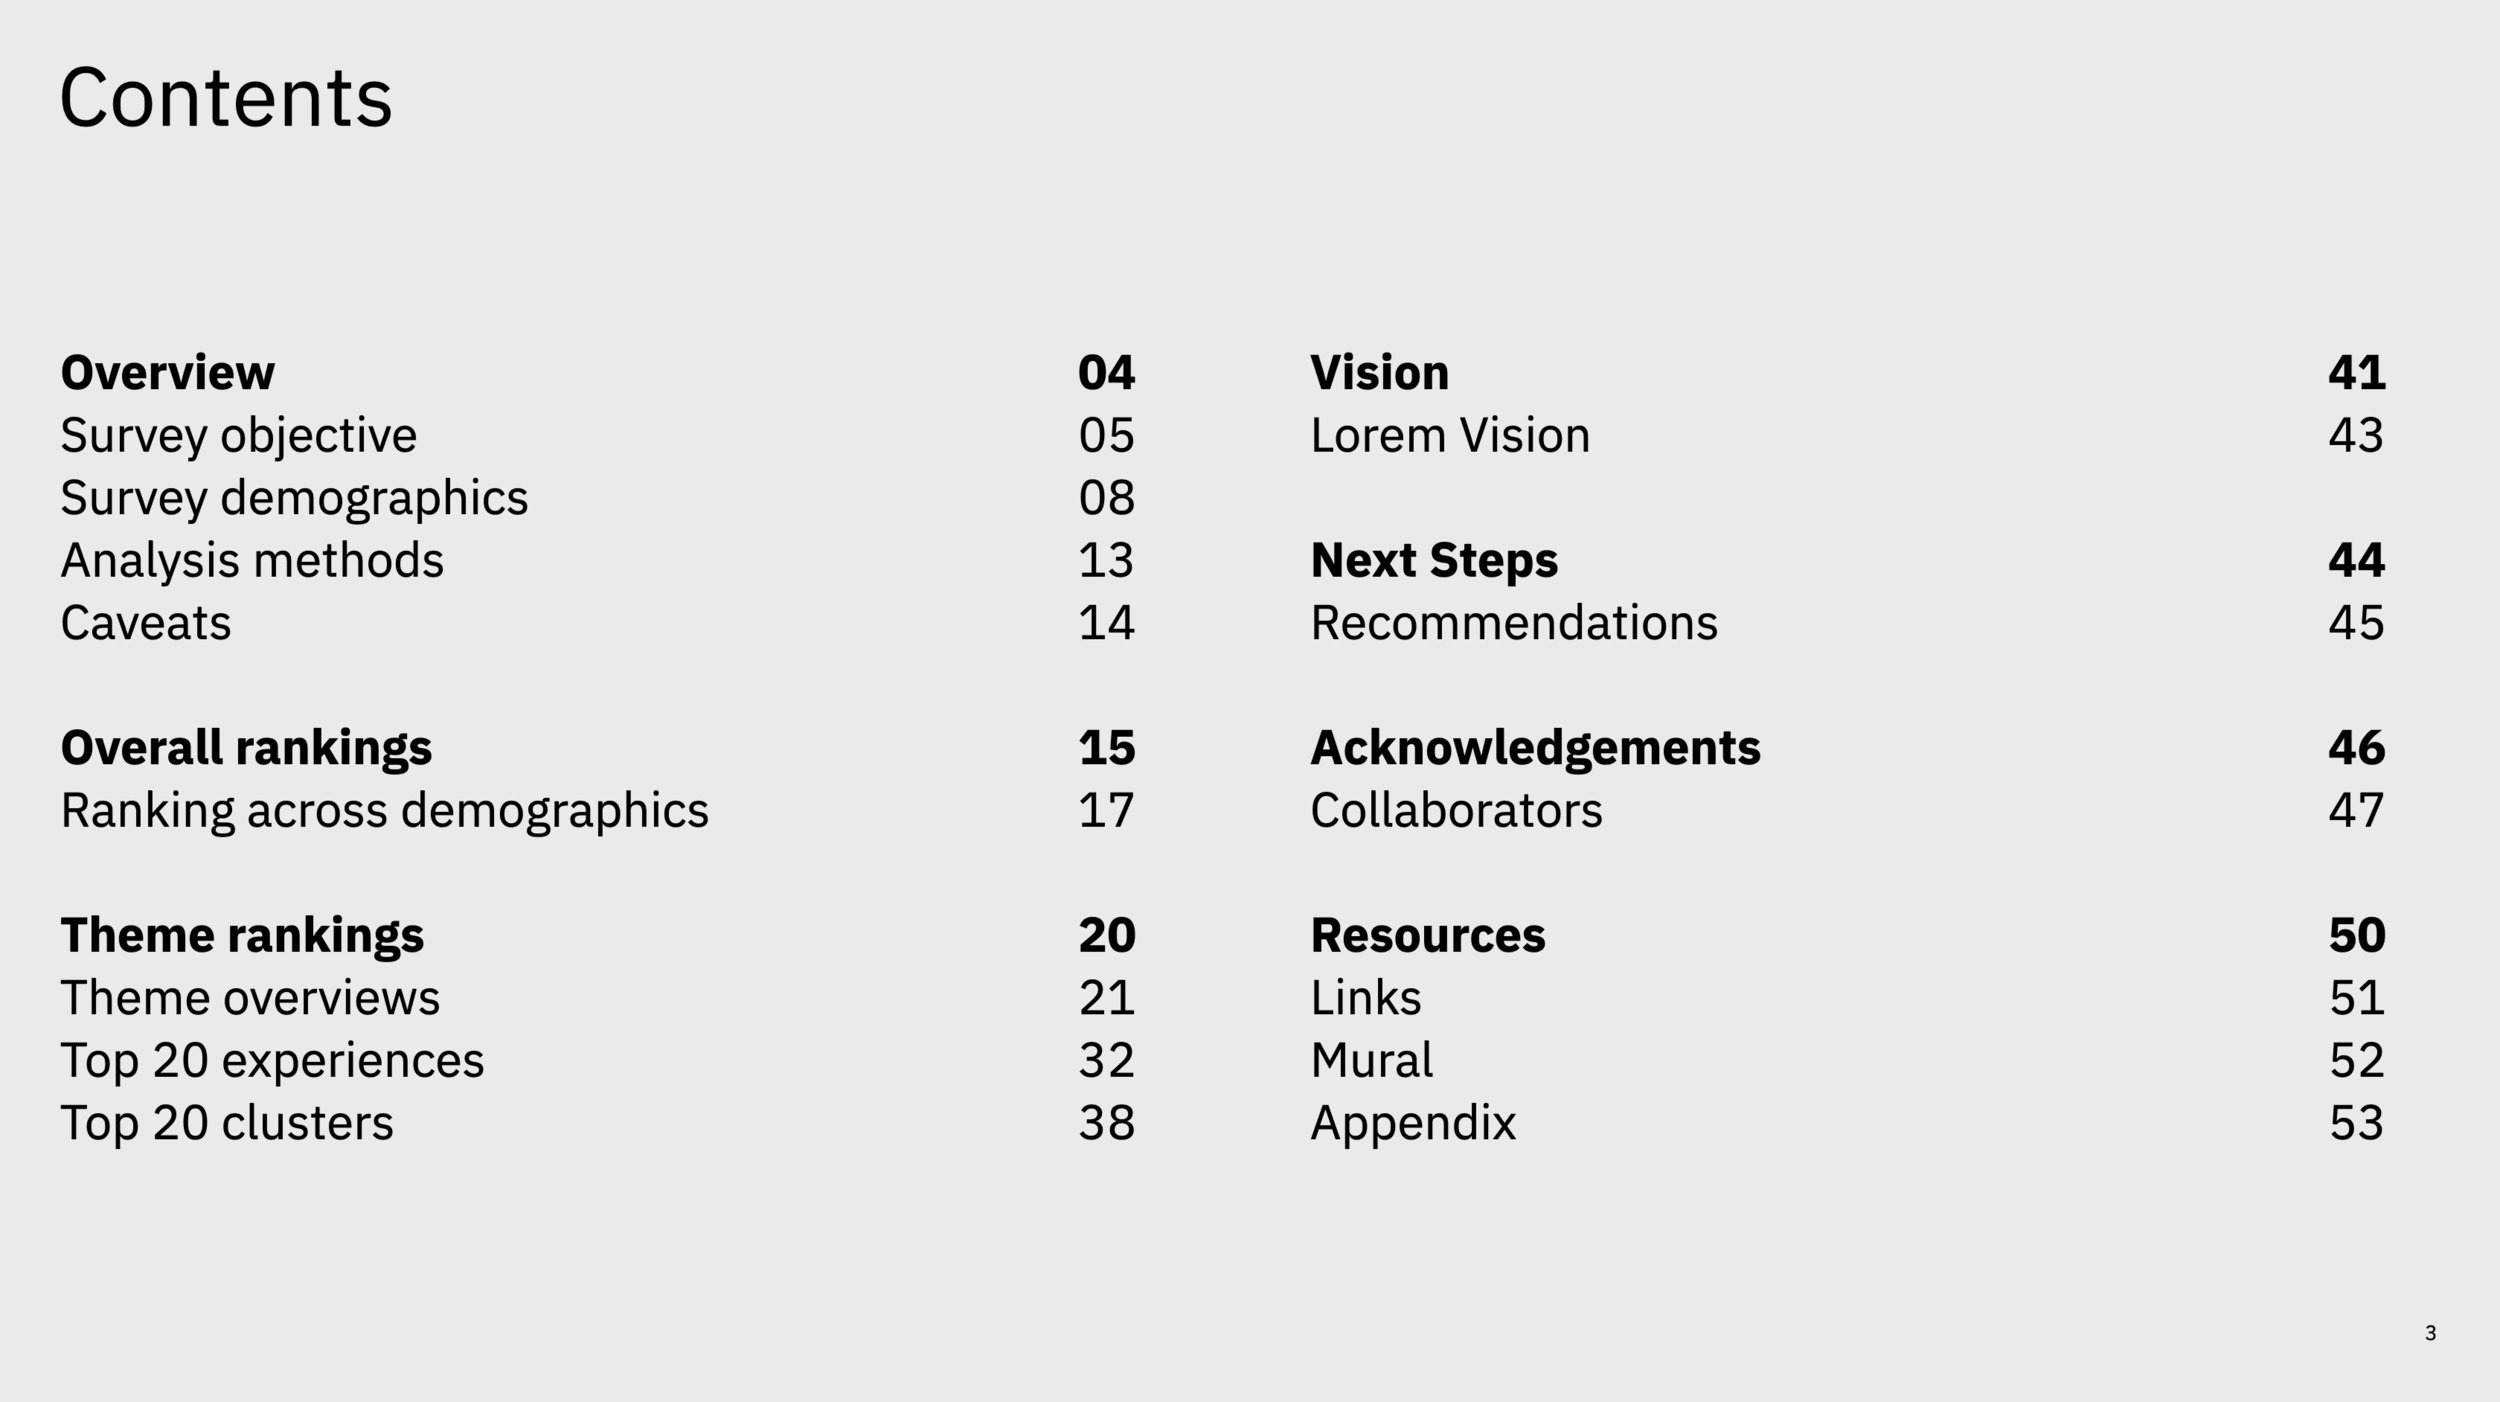
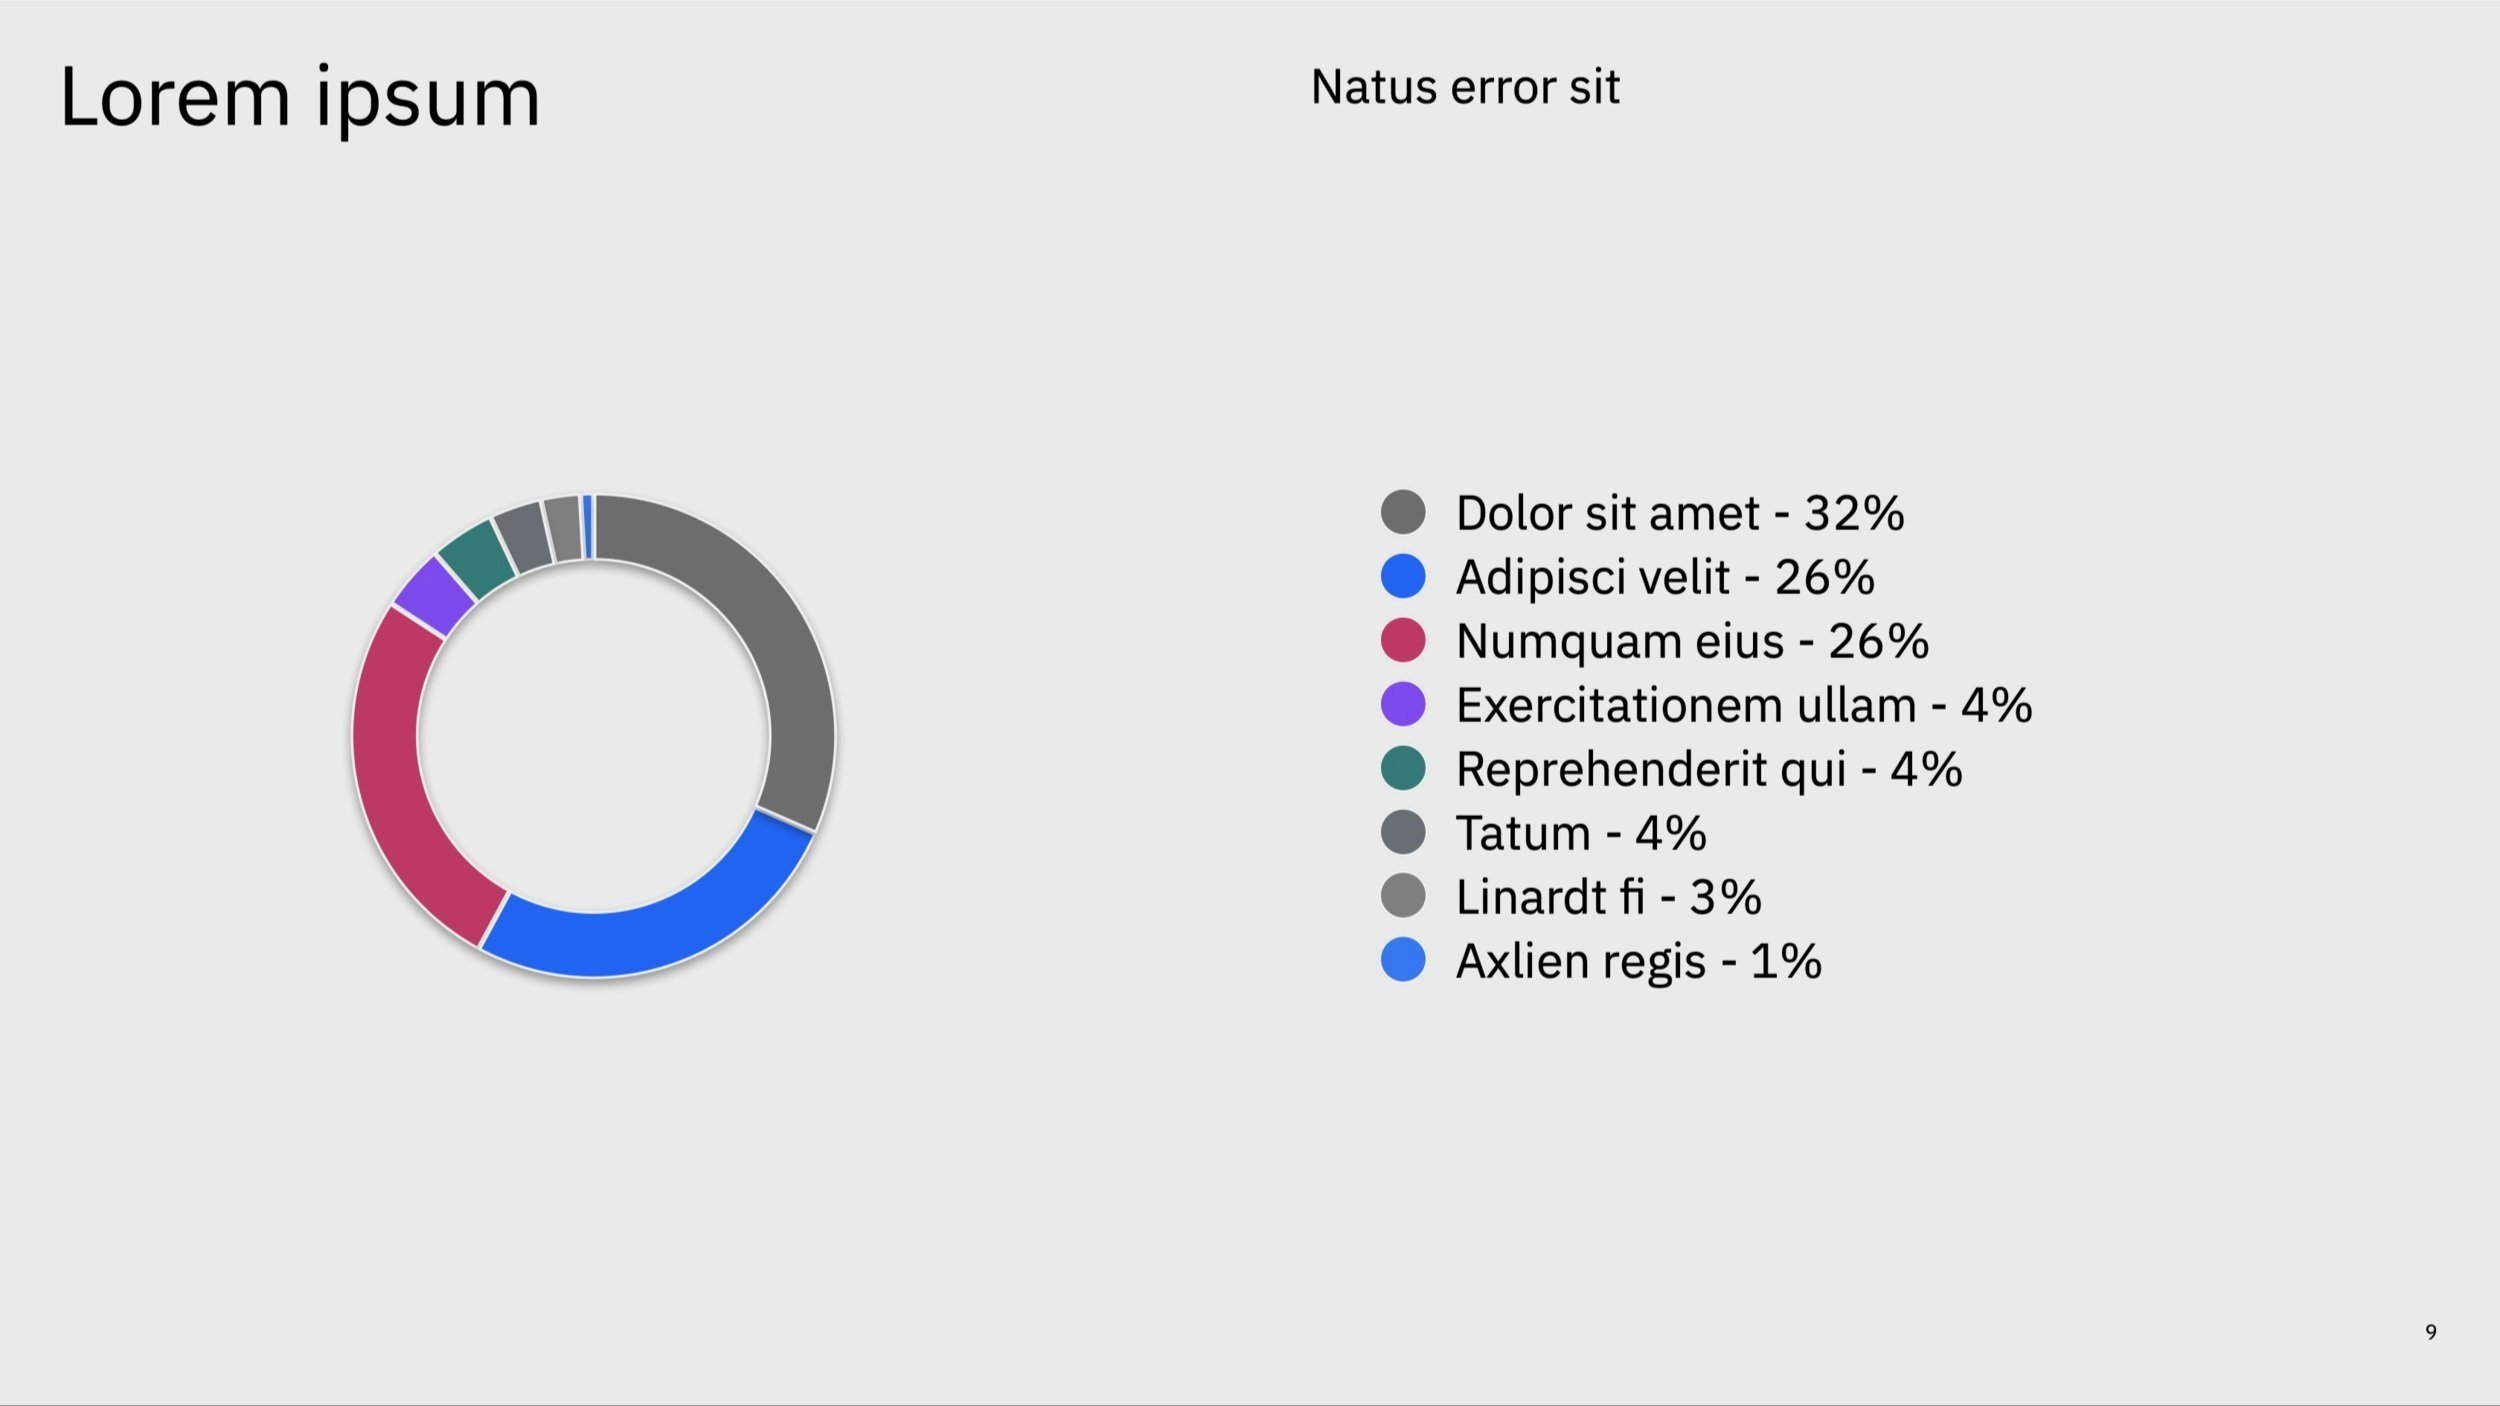
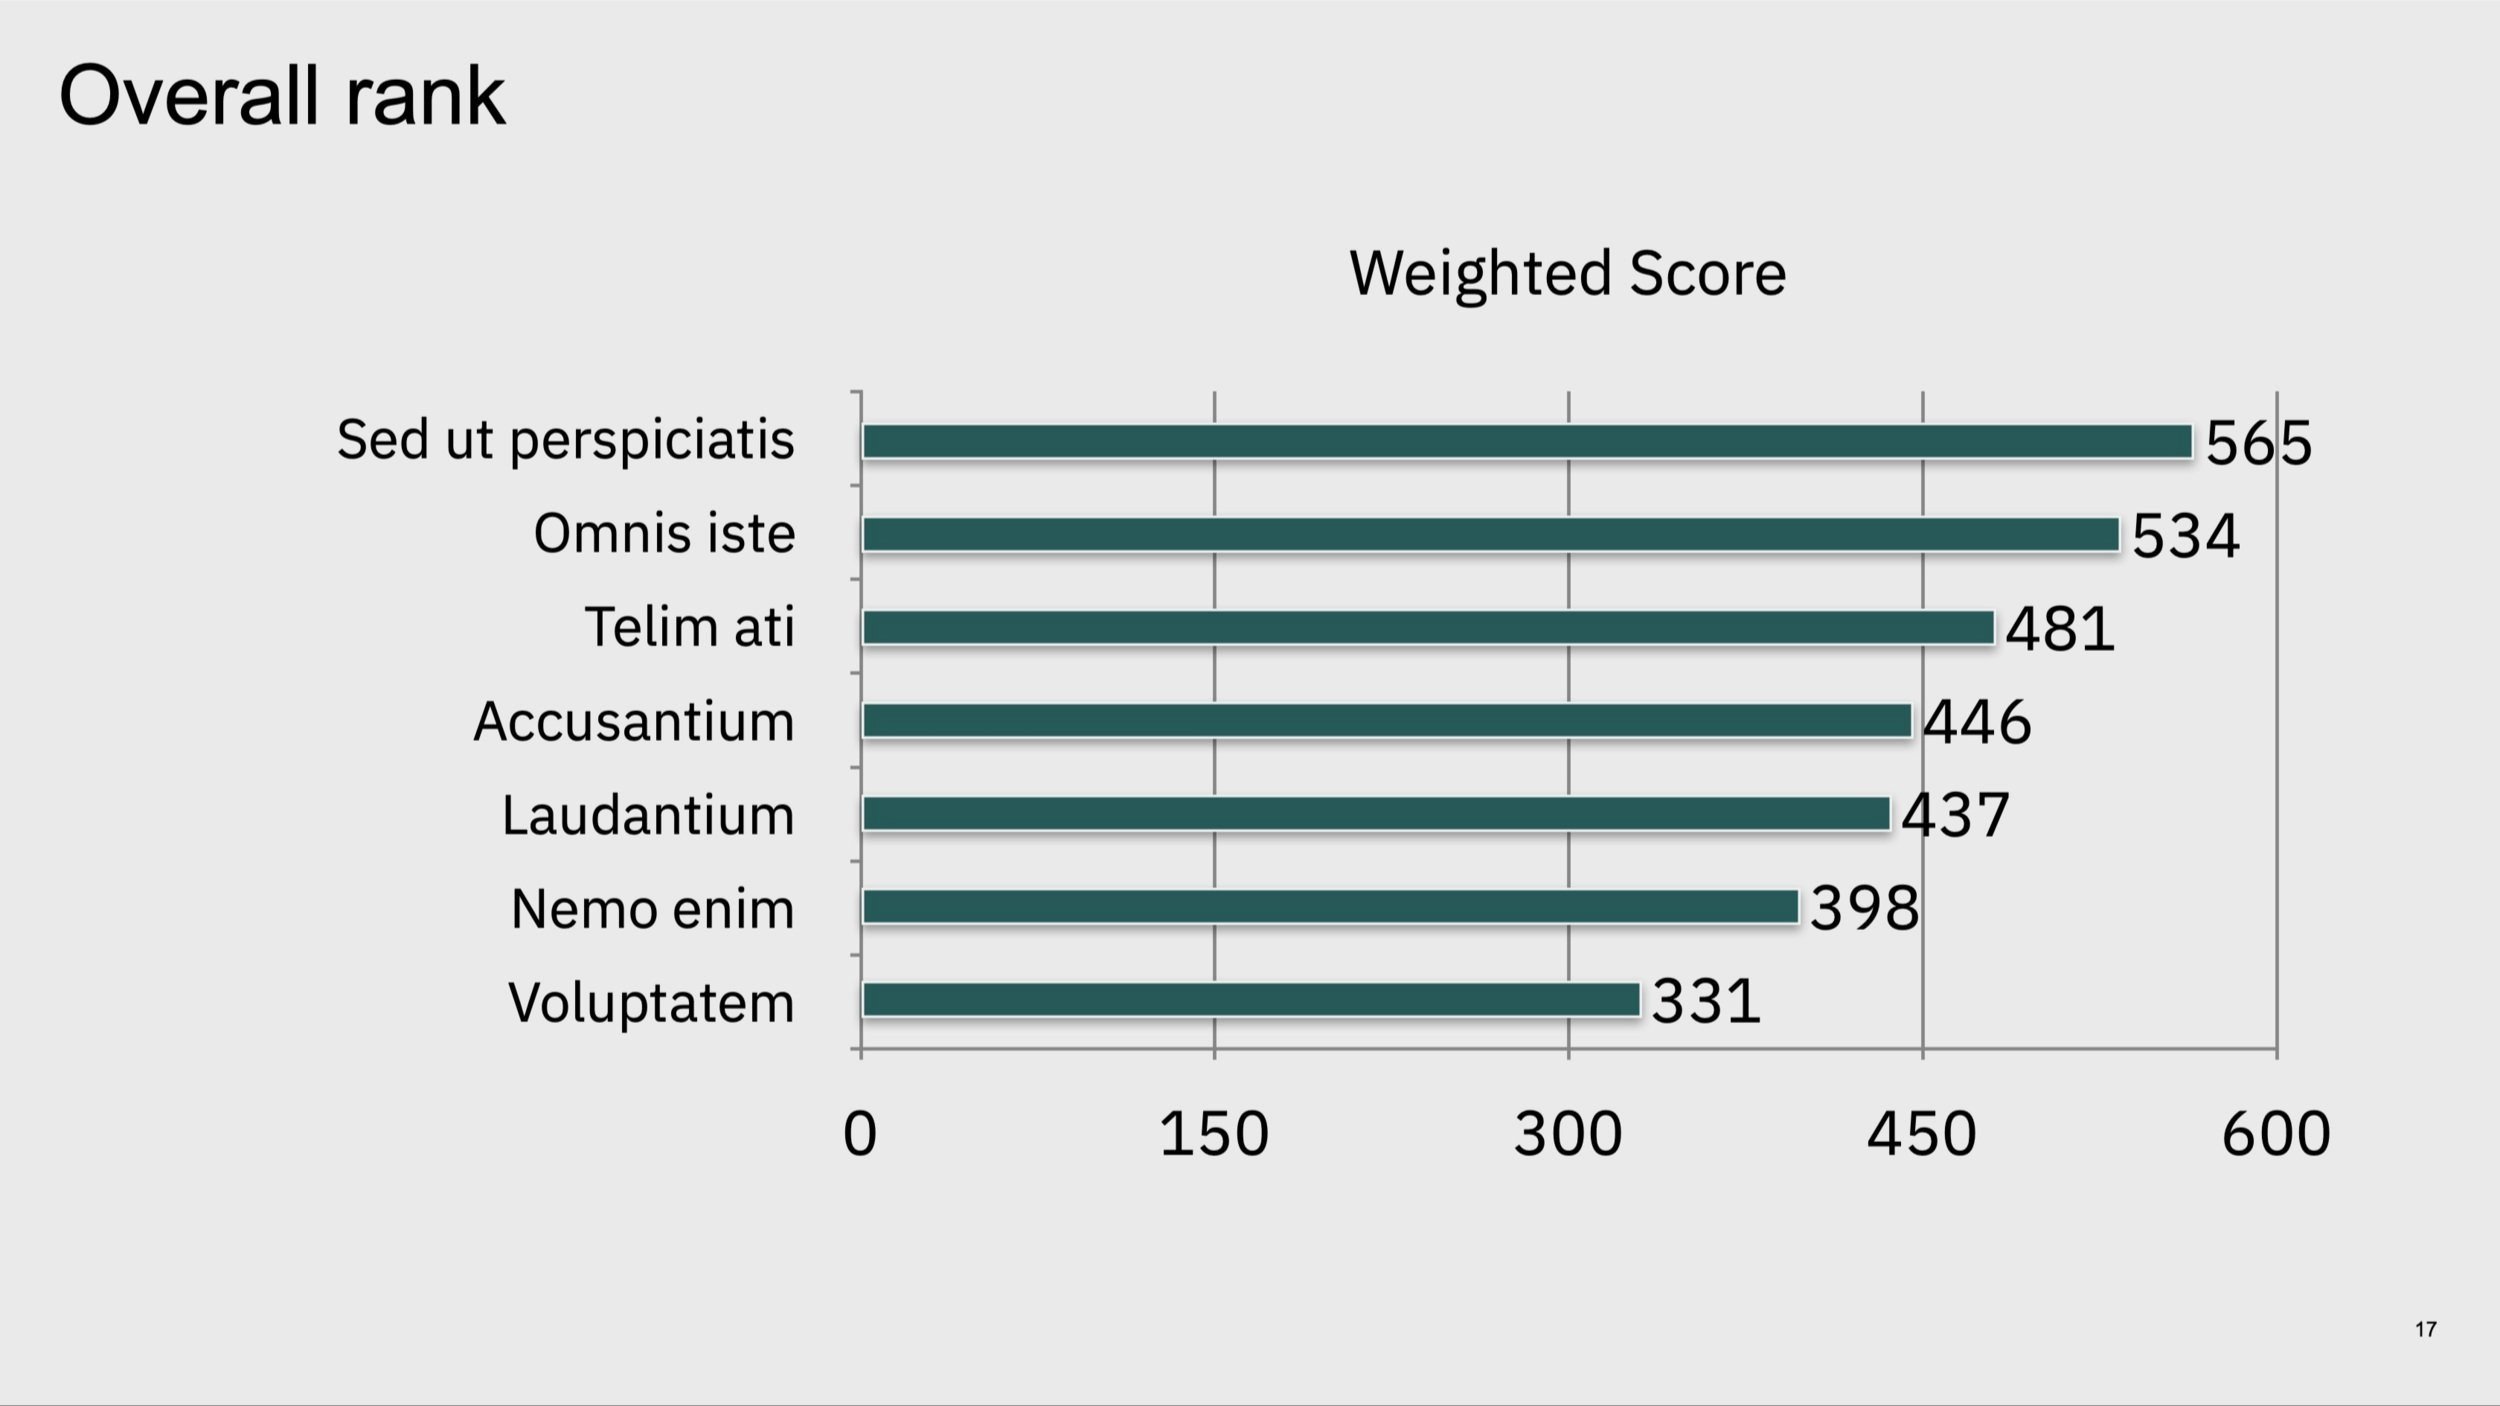
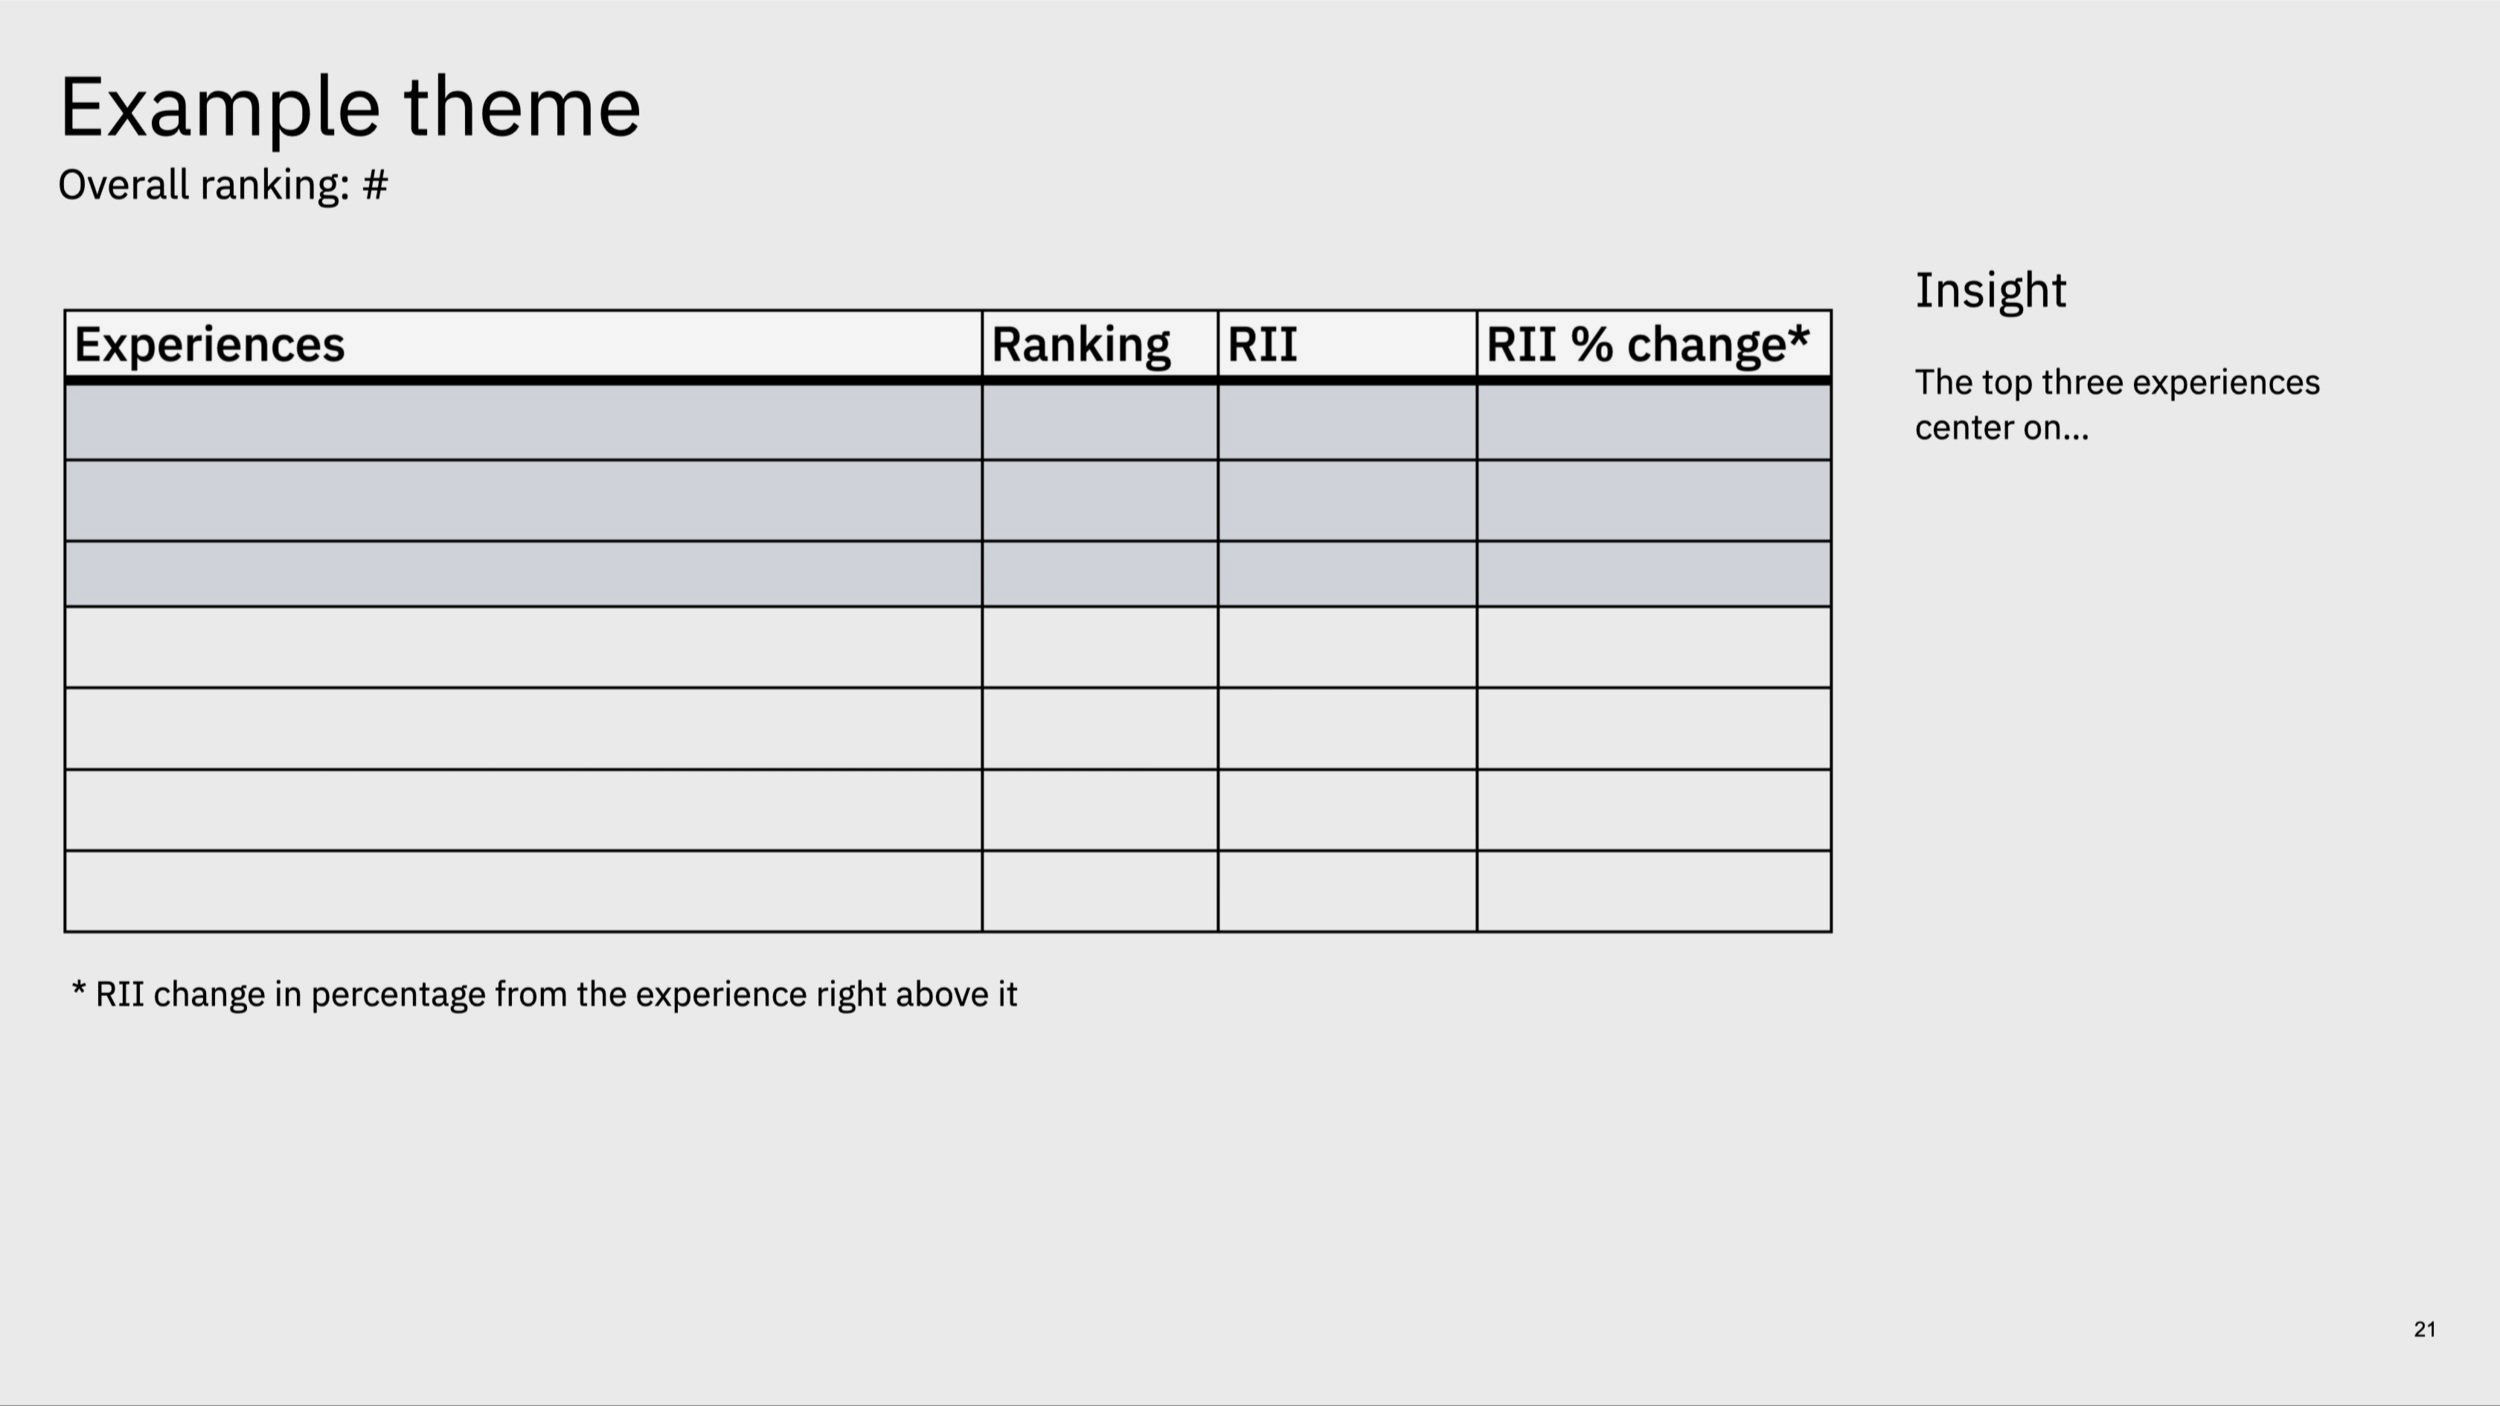
Redacted Presentation Sample Screens
Personal takeaways
The validity of quantitative figures can be met with skepticism even if you involve all the right people in its development.
It's vital that when you present a survey analysis, you indicate its limitations to prevent stakeholders from drawing faulty conclusions.
Randomizing answer choices for survey questions and creating straightforward content is imperative to reduce user bias.